With the number of changes companies have made to their accelerated underwriting (AU) programs over the last several months, one could easily argue that perhaps now more than ever it is important to measure the impact these changes have had on individual programs and the industry. In response to these changes, SCOR developed a benchmarking tool to better track, monitor and measure the performance and accuracy of AU programs. The tool delivers the ability to perform a more insightful benchmark analysis.
At the onset of the pandemic, companies had to quickly develop a strategy and implement a plan to mitigate the disruption and potential loss of new business. This disruption was largely driven by carriers’ inability to obtain traditional exams and labs.
To ensure the safety of their employees and avoid possible exposure, paramedical companies briefly suspended examinations, which created a substantial backlog of pending cases. Applicants also voiced their reluctance to meet in person with either agents or examiners. Companies had to find another way to obtain medical information sufficient/comparable to adequately assess risks.
Digital health data arrive
Cue digital health data (DHD) sources such as clinical labs, medical claims data and electronic health records. Companies not already using DHD sought to implement them into their AU process. Some companies had started to explore and study the benefits of these sources prior to the pandemic, while others had only been considering as a future endeavor. The pandemic prompted several of those companies to quickly move forward to begin testing in a live production environment. Implementation of these data sources have occurred in both traditional and AU processes.
Eligibility expansion
Companies also had to find a way to accommodate the significant influx of new business which accompanied the spread of the pandemic. That increase in business has continued well into 2021. Agents, who may have been unfamiliar or resistant to submit applications through an AU program prior to the pandemic, now feel obliged to utilize this channel to provide coverage for their clients or risk losing business.
One major strategy that companies chose to address the rise in use of their AU programs was to allow more applicants to flow through the process. Many companies temporarily expanded their AU eligibility guidelines to allow for older ages and higher face limits, and in some cases, added plan types. Since then, these “temporary” expansions have become permanent changes to the eligibility rules.
Program monitoring
Companies with an AU program understand that continued and routine monitoring is vital to measuring the performance and accuracy of an AU program. One unintended consequence of not being able to obtain exams and labs was the temporary suspension of Random Holdouts (RHO), which help companies to determine if the AU program results remain in line with expectations. Companies have since resumed the practice of RHOs, but the potential ramifications of suspending RHOs is largely unknown.
Underwriting Reimagined: AU benchmarking
SCOR recently had the opportunity to showcase the functionality and capabilities of the benchmarking tool with several clients during our AU Benchmarking Underwriting Reimagined discussions. These discussions allowed us to gather more insight on each company’s program, which is often difficult to extract from reporting and monitoring results alone.
AU programs are often similar but may differ greatly due to the multiple variables such as target market, distribution, eligibility and so on. The aim and purpose of our benchmarking discussions was to compare how a company’s program stacks up against its peers and to provide meaningful insights to our clients. We shared our observations and insights as well as potential recommendations based on what we are seeing across the industry, knowing that what works for one program may not always be effective for another.
Based on the reporting we receive from our clients’ AU programs, utilizing random holdout results only, we identified several commonly reported metrics that we consider core to measuring the overall performance and accuracy of a program. We focused on programs using RHOs because they more closely measure how well AU decisions align with a fully underwritten risk. We also see great disparity in the overall accuracy of companies performing RHOs versus companies performing post-issue APS monitoring only.
The basis of our AU benchmarking discussions focused on the following key performance and accuracy metrics as noted on the images below.
Figure 1 - Performance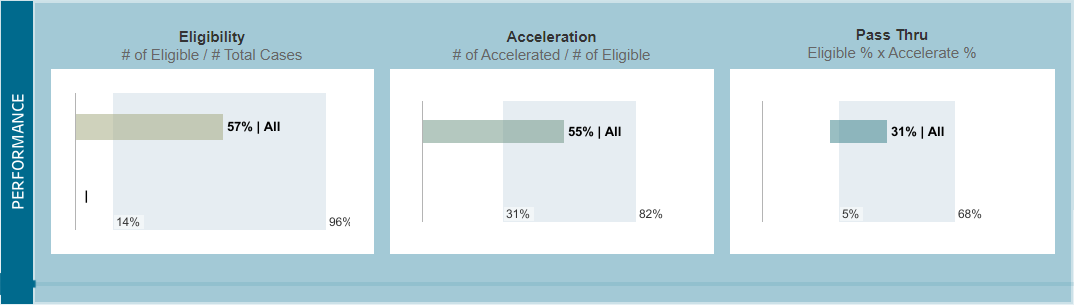
This grid illustrates three key performance measures: eligibility, acceleration and pass thru. The blue shaded areas represent the range of results, and the smaller bars represent the average percentages for all clients.
Figure 2 - Accuracy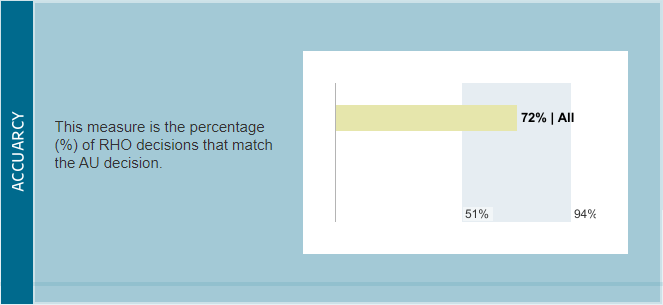
The average for all clients is a 72% match rate when RHO decisions match the AU decision.
Figure 3 - High Risk Misses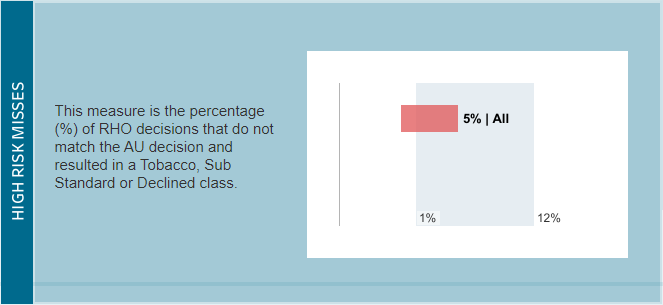
Only 5% on average of RHOs do not match AU decisions.
Data sources which appear to have the greatest impact on the performance and accuracy of AU programs include:
- Electronic Health Records (EHR)
- Rx-based risk scores
- Medical claims billing
- Proprietary predictive models (PPM)
Data sources which appear to have limited impact on the performance and accuracy of AU programs include:
- Credit attribute scores
- Clinical labs
Based on initial reporting results, companies utilizing electronic health records and/or medical claims billing are achieving better ‘as expected’ accuracy while reducing the number of ‘high risk misses’, while companies using Rx-based risk scores have lower Tobacco misses.
Proprietary predictive models are models built using a company’s own data. AU programs with PPMs outperform programs that do not have PPMs. Eligibility is 40% higher, acceleration is 9% higher and pass-thru for AU programs with PPM is 45% higher compared to non-proprietary model programs. PPM companies have been able to achieve an average accuracy rate of 81% compared to 69% of non-proprietary model programs. High risk misses, which represent over 90% of overall mortality slippage, are half that of programs that do not have a PPM (3% vs 6%).
A number of states have expressed concern about the use of algorithms and predictive models being used in life insurance underwriting. A few states are in the process of enacting legislation restricting their use, and as a result, some companies have begun to shy away from them. SCOR’s data science team is committed to helping clients identify ways to provide transparency in their models and processes to help mitigate these regulatory concerns.
Conclusion
As mentioned, multiple variables can and do impact the results of an accelerated underwriting program. The performance of each program should be monitored and assessed independently and objectively. SCOR utilizes the AU benchmark tool as an opportunity to:
- assist in showing whether programs are meeting their stated objectives and if results are in line with expectations; and
- provide SCOR’s recommendations to improve an AU program and help in achieving its goals.
The AU benchmarking tool is continually updated and is a resource available to SCOR clients who provide data on their AU programs.
The benefits of accelerated underwriting to applicants, direct companies and reinsurers are clear – faster, less intrusive, cost-effective underwriting with minimal mortality slippage, especially in programs that make use of the latest data sources and predictive models.