Analysis of post level term (PLT) behavior is important for all life insurers with term business, because policyholder retention and the extent of anti-selective behavior influences the balance of premium and claims in PLT and directly impacts the profitability of the product as a whole. PLT lapse and mortality assumptions impact pricing, product design, inforce management, capital modeling and reserving for US term products.
In 2017, SCOR R&D undertook a significant exercise to analyze experience on the Jump to ART structure and through statistical analysis developed a model to determine lapse and mortality assumptions.
Jump to ART is the most common PLT structure, in which the premium significantly increases and continues increasing annually after the level rate during the initial term period. Though this is the most common structure historically in the US market, different structures are becoming increasingly important as companies seek to optimize their PLT experience. SCOR R&D expanded PLT analysis in 2018 to increase understanding of other structures.
PLT Structures
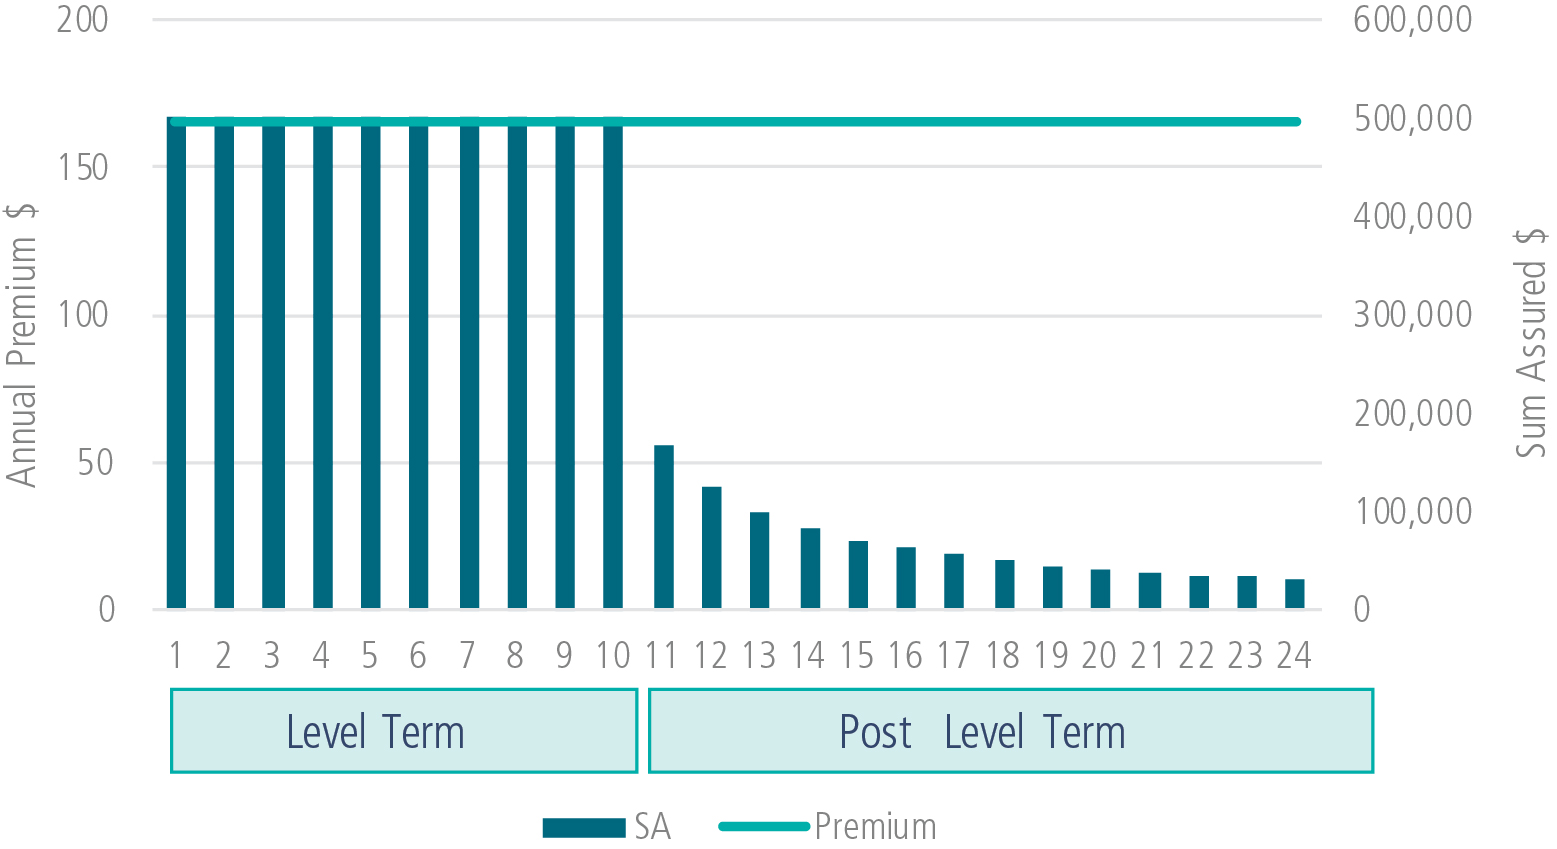
Decreasing Term is a PLT structure which allows the premium to remain level after the end of term (Figure 1). Instead of a premium increase, policyholders face a reduction in Face Amount. In one way this is meeting a customer need, which continues cover at an affordable price.
Figure 1: Decreasing Face Amount Structure
Jump to New Level is the predominant structure in the Canadian market. At the end of the initial term period, the premium increases but then remains level for a new term period (Figure 2).
Figure 2: Jump to New Level Term Structure
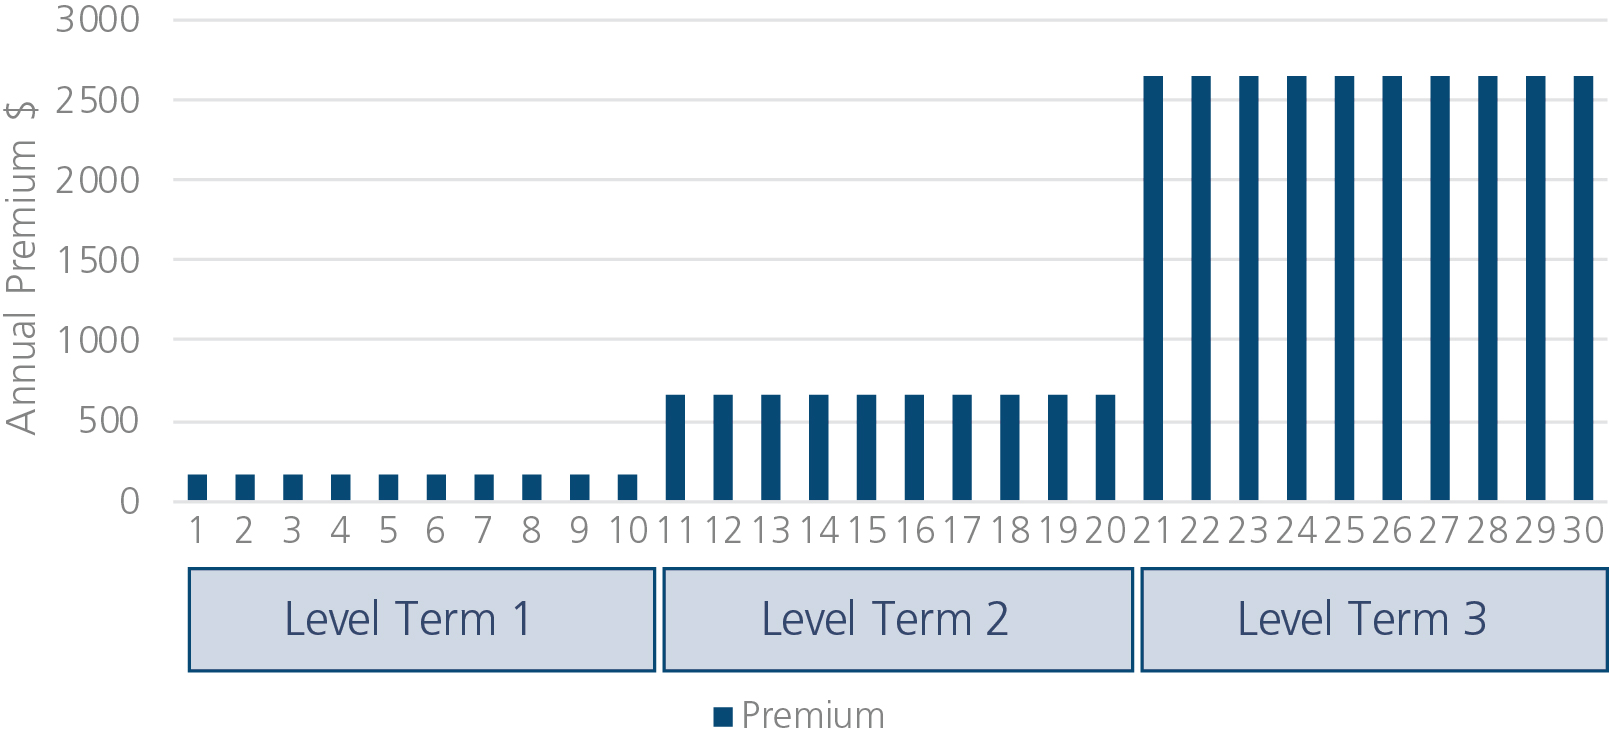
Premium increase is still a key driver of behavior at the end of term. In the Canadian market, average premium jumps are increasing over time as level term rates are reduced in a competitive market, and PLT rates have been maintained. SCOR has found that analysis including premium increase is indispensable when using historic experience to predict lapse and mortality assumption for business that may have different premium increase levels.
Graded PLT is a structure that has stepped increases over a five to 10-year period before reaching an ART scale. Lower initial premium increases with significant steps up in subsequent years are features of this structure.
Some companies have adopted this Graded PLT structure for a long time, and their policyholders will have Graded PLT rates as standard. In the past five years, many companies have considered pilot programs to test the impact of applying a Graded structure rather than a Jump to ART structure.
Common practice involves communicating with policyholders at the end of term and offering Graded PLT premiums with lower end of term premium jumps and stepped premiums for a period before reaching an ART scale.
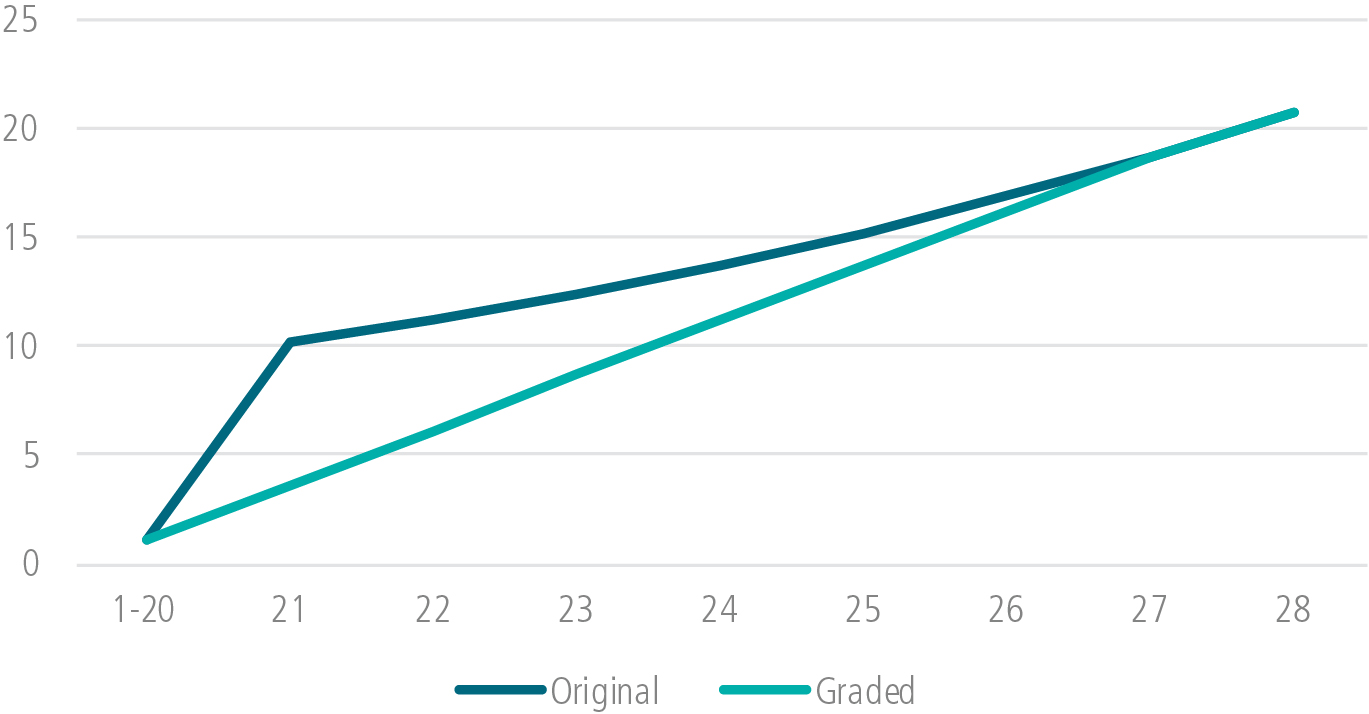
When changing to a Graded PLT structure, the PLT rates may reach
the same level as the original Jump to ART structure at some point
(Figure 3).
Figure 3: 20-Year Term Graded to Current PLT Rates
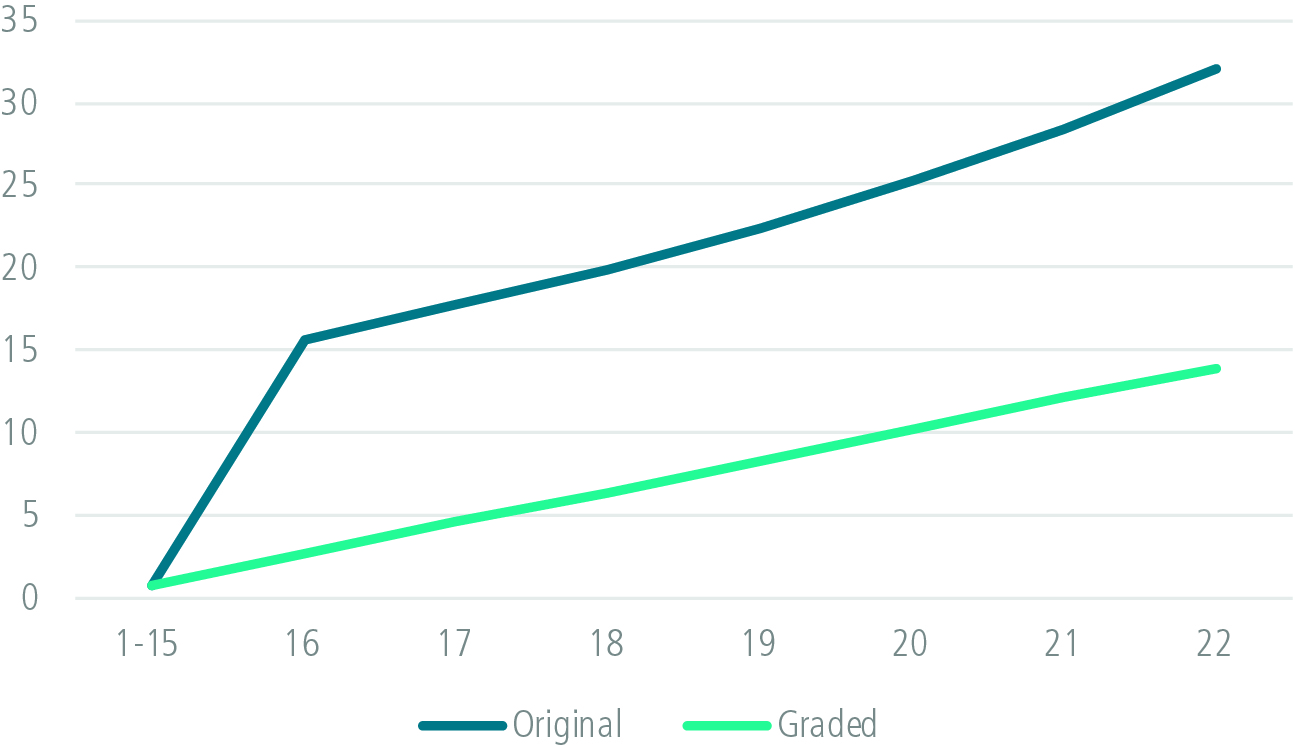
Alternatively, under the new structure PLT premiums may grade to ultimate rates that are set as a multiple of an industry table (Figure 4). Often the approach will depend on the original PLT structure where grading to original PLT rates is less sensible when original jumps were particularly high.
Figure 4: 15-Year Term Graded to Multiples of Industry Table
Optimizing Post Level Term Results
The aim when changing PLT structures is to improve persistency by presenting a lower premium jump at the end of term. A key take-away from SCOR R&D analysis on PLT has been that the relationship between premium jump, lapse rate and mortality deterioration is clear in experience analysis. For the Graded PLT structure we also need to consider the subsequent premium increases in PLT which are significant annual increases relative to the ART scale of the Jump to ART structure.
As well as considering the annual premium increase at the end of the term and into PLT, it has been interesting to compare the PLT premium to new business premiums available in the market. In particular for the longer-term products, when premium jumps are in the range of two to four times that of the level premium, we have identified cases where the PLT premium represents good value compared to the rates the policyholder could expect for current age.
A feature of the Graded PLT structure is that PLT premiums vary by risk class, compared to the smoker/non-smoker rates that were more usual under the Jump to ART structure. A policyholder who qualified for a preferred rate based on underwriting 20 years ago is eligible for a PLT preferred premium. This policyholder may not qualify for a preferred rate now and may be comparing the Preferred PLT rate to new business rates for residual classes.
Comparison to available rates in the market is becoming easier for customers, and the emergence of accelerated underwriting makes newly underwritten rates more accessible. New business rate comparisons will have increased influence on consumer behavior.
The search is for that perfect balance, where the premium increase will drive behavior that leads to persistency of the appropriate mortality group for which that premium can cover all claims. SCOR R&D seeks that sweet spot and wants to identfy how it might vary between structures.
Any changes in the PLT structures for business about to reach PLT have the advantage that experience is emerging in the coming years. Communication of the change is something that will also affect policyholder behavior, and SCOR has therefore been separately analyzing experience where policyholders had a Graded PLT structure in the original policy and those where policyholders were offered a Switch to Graded PLT structure just as their policies reached PLT.
As other premium structures gain prevalence in the market, SCOR R&D extends research to study differences in lapse and mortality as premium structure varies.
Analyzing the Data
Research indicates that policyholder behavior can be empirically
distinguished into three broad categories
- Macroeconomic factors
- Company-specific factors
- Policy-specific factors
However, our data is mostly comprised of the latter two categories. Regression-based models (GLMs) are by far the most used tools to fit and predict probabilities, to capture empirical dependencies among factors and to understand the best factors to calibrate the lapse risk as accurately as possible. GLMs provide a powerful statistical analytics tool to investigate the underlying reality of the parameters available in the data to show how previously ignored parameters may have affected observed policyholder behavior.
Similar to our 2017 research on the Jump to ART structure, lapse experience for Graded PLT and Switch to Graded PLT structures was modeled using a GLM assuming a Poisson probability distribution and a logarithmic function that linked the explanatory variables to the expected value of the variable modeled (lapse rate). The GLM output consists of an intercept, and for each factor, a series of multiplicative coefficients showing the relative effect at the levels for each factor.
Some of the explanatory power came not only from the premium jumps but also from other policy-specific variables (e.g., Face Amount, Age). Interaction between these explanatory variables needed to be assessed carefully. Variability in shock lapse behavior introduced by company-specific factors was observed as well.
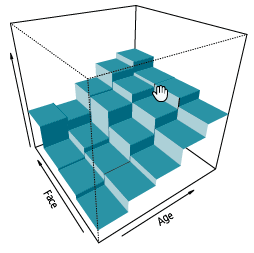
Shown below are surface plots that demonstrate the modeled relationship between lapse rates and relevant factors like Face Amount and Age. The interactive impact of increasing face amounts and higher ages on shock lapses is demonstrated in the
plot below.
Figure 5: Face Amount - Age Impact on Lapse Rates
Similarly, the jump-age effects are shown below.
Figure 6: Jump - Age Impact on Lapse Rates
With GLM as the benchmark, SCOR R&D also evaluated the usefulness of decision tree algorithms such as CART (Classification And Regression Trees), a machine learning algorithm that falls under the category of supervised learning. Since our goal was to predict lapse rates, we utilized the regression tree’s version of the algorithm.
The decision tree algorithm is based on recursive partitioning, which involves dividing up the multidimensional space of explanatory variables into non-overlapping multi-dimensional spaces. A random 80/20 split was used, training the model on 80% of the data and making the prediction on the remaining 20%. The goal is to match the predicted lapse to the actual as closely as possible in the test data.
The flow chart like structure of decision trees provided clarity to the logic used in partitioning the data into segments of the shock lapse ranges that were predicted from the combinations of the features used to construct the tree. While the main advantage of using decision trees are its interpretability, they are often susceptible to the risk of overfitting/overlearning. We deal with this disadvantage of being sensitive to local optima by using model aggregation/ensemble methods as solutions.
Figure 7: Model Performance Comparisons
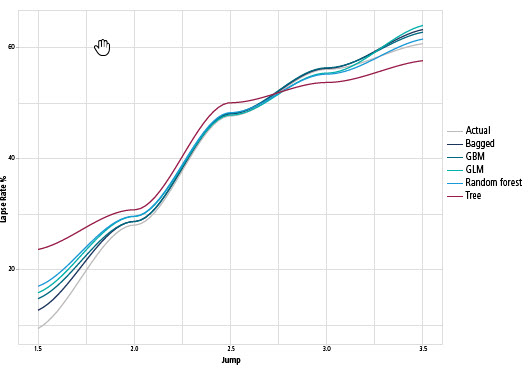
Tree-based ensemble methods like bagging (Bootstrap AGGregatING), random forests and GBM (Gradient Boosting Machine algorithm) were utilized to optimize model performance and for comparison. Interpretability however is lost after utilizing these ensemble techniques, since representing the prediction path on a single tree is no longer possible. However, an overall summary of the importance of each predictor can be obtained via relative influence plots.
Our research indicates that the GLM and tree-based models seem to work comparably well on this study data that predicted shock lapses. Quantitative measures (such as the predictive performance and the computational time) and qualitative measures (like interpretability and implementation) were pivotal factors in final choice of methodology.
Similarly, post shock lapses were modeld with a combination of factors that were used in the shock lapse model. A key component, however, that needed to be taken into consideration specifically for Graded structures was the annual subsequent premium increases after the end of term.
Again, usage of decision trees was pivotal as the algorithm itself is non-parametric and works without imposing a complicated parametric structure (e.g., linear relationship for regression). As mentioned before, this methodology, which helps in developing prediction algorithms for a target variable based on multiple features, helps us to hone in on the most relevant ones (aka the variable selection process).
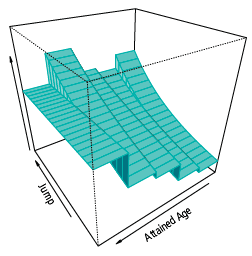
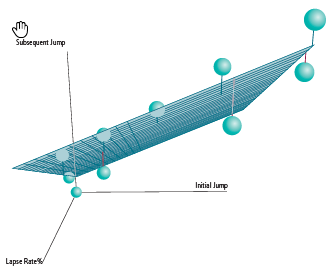
The ability to do this with little to no data preparation is an added benefit. The relationships of the lapses with the initial and subsequent jumps and their possible interaction, while controlling for additional factors, were carefully considered to build a robust model. The surface plot in Figure 8 shows the association of the lapse to the initial and subsequent jump observed across all successive durations.
Figure 8: Association of Lapse to Initial and Subsequent Jumps (All Successive Durations)
When considering a Graded structure, the subsequent duration lapses are significant – often the lapse in the first duration in PLT (N+1) can be almost as substantial as the end of term shock lapse. The significant subsequent premium increase is a factor but the initial premium increase remains an important aspect.
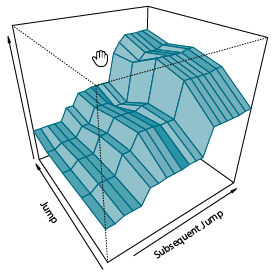
Figure 9 is a snapshot of lapses in N+1 duration and how this varies by initial and subsequent jumps.
Figure 9: Lapses in N+1 Duration Showing Variation by Initial and Subsequent Jumps
Mortality
While we still need more data to model post level mortality at a more granular level, the association between shock lapse and mortality deterioration continues to be pivotal under other PLT structures. Though initial PLT mortality deterioration can be studied, mortality experience under the Switch to Graded structure is still only available for initial PLT durations.
As we have seen, the premium increase pattern and post shock lapse pattern in PLT are different under the Graded structure, so attention needs to be focused on the mortality deterioration pattern in PLT. Increased persistency will only improve the PLT value if it is successful in achieving reduced anti-selection and lower claims throughout the PLT period. As mortality experience develops into later durations in PLT, SCOR will continue to study the pattern of claims to complete the picture for this increasingly popular Graded structure.
Conclusion
As lapse and mortality experience emerges for these alternative product structures and as we garner more data, SCOR’s R&D is committed to integrate data and analytics and to derive new insights on policyholder behavior through advanced statistical and machine learning techniques. Should you have any questions on this analysis, SCOR R&D would be happy to discuss further.