U.S. general population mortality improvement and trends by cause of death are helpful in understanding mortality improvement of the U.S. individual life insured population. SCOR’s U.S. Experience Analysis team has analyzed the latest U.S. population deaths using data from the Centers for Disease Control and Prevention (CDC) and data from the U.S. Census. The most recent data was released in December 2021, which includes deaths through the end of 2020. This includes the first look at final CDC data covering the first 10 months of the COVID-19 pandemic in the U.S., which has had significant impacts on both the U.S. population and insured population mortality.
This analysis explores changes in mortality improvement trends and causes of death that contributed most to these changes, including COVID-19.
Mortality Improvement Trends
The U.S. population has shown different levels of mortality across the years. The exhibit below displays the age-adjusted mortality rates1 from 2000 to 2020 by gender. The age-adjusted rate is only used in this exhibit because all ages are combined in the mortality rate comparisons. All other exhibits use the mortality rate without adjusting for age changes by year.
Age-Adjusted U.S. Population Mortality Rates for Ages 15+
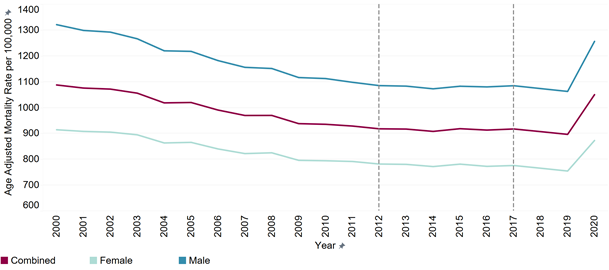
The age-adjusted mortality rate increased significantly in 2020 due to the COVID-19 pandemic for both males and females. The combined age-adjusted rate increased from 896.9 deaths per 100,000 in 2019 to 1,050.5 deaths per 100,000 in 2020. The increase in the combined age-adjusted rate in 2020 increases mortality to a level not seen since 2003, essentially wiping out 17 years of mortality improvement.
The increase in 2020 was primarily driven by deaths due to COVID-19. However, deaths due to cardiovascular, external, Alzheimer’s and dementia, diabetes and the residual causes also increased in 2020. We do not expect that the mortality levels will continue at the 2020 levels as we exit the pandemic. However, it is still unknown where they will end when COVID-19 becomes endemic. SCOR recently published an article discussing some of these potential medium- and long-term effects of the pandemic on mortality at a high-level.
U.S. population experience varies significantly by age. While all age groups experienced a significant increase in the mortality rate for 2020, the percentage increase was largest for ages less than 55. The age group 40-44 experienced the largest increase with a 24.7% increase in the mortality rate compared to 2019, largely driven by deaths due to COVID-19 and external causes.
These deaths from external causes are largely driven by the increase in synthetic opioid overdoses such as fentanyl. This increase is much more prevalent in lower socioeconomic groups than in higher socioeconomic groups. From previous analysis performed by SCOR’s U.S. Experience Analysis team, it was observed that the individual life insured population is not as impacted by this cause of death due to this socioeconomic difference. Therefore, the increases observed in the insured population for ages under 55 will likely be muted compared to those observed in the U.S. population. Age group 90+ experienced the smallest increase with a 14% increase in the mortality rate compared to 2019, largely driven by deaths due to COVID-19 and Alzheimer’s and dementia.
U.S. population mortality varies significantly by socioeconomic status. Mortality rates tend to decrease and life expectancies rise with income, education and other measures of socioeconomic status. Better-educated, higher-income people live longer, on average, than less-educated, lower-income individuals.
People at higher socioeconomic levels are also more likely to seek out individual life insurance than those with less disposable income. This analysis uses educational attainment as a proxy for socioeconomic status since income is not readily available. Focusing on the more highly educated portion of the U.S. population can provide insights into impacts that may be observed in the insured population.
In 2020, the lowest level of educational attainment, those who have not graduated from high school, saw the largest increase in the mortality rate with an increase of 20.6%. Those with the highest level of educational attainment, those who have achieved a graduate degree or higher, saw the smallest increase in the mortality rate with an increase of 14.8%. It would then be expected that the insured population would skew towards a smaller increase in the mortality rate from 2019 to 2020.
Impact of COVID-19
COVID-19 was the third leading cause of death in 2020, accounting for 10.5% of all deaths (ages 15+). Furthermore, 11.2% of all deaths had COVID-19 somewhere on the death certificate (i.e., it was an underlying and contributing cause of death). Overall, 46.1% of all COVID-19 deaths were observed in ages 80+, 41.9% in ages 60-79, 11.9% in ages 25-59, and 0.2% in ages 15-24. This compares to the distribution of all deaths across age groups in 2019 of 43.6%, 39.0%, 16.4% and 1.1% respectively. This is due in large part to the fact that the immune system naturally weakens with age. Males represented 54.4% of all COVID-19 deaths compared to 51.6% of all deaths in 2019. However, there is no medical consensus on why this is the case.
The impact of COVID-19 also varied by socioeconomic status for the U.S. population with lower socioeconomic groups, as estimated by educational attainment, experiencing a higher percentage of COVID-19 deaths. Deaths from those with only some high school education made up 24.0% of all COVID-19 deaths compared to 19.0% of all deaths in 2019. Those who were high school graduates saw no change in the distribution with 43.6% of all COVID-19 deaths from this educational attainment level compared to 43.7% for all deaths in 2019. Individuals with some level of college education made up 32.5% of COVID-19 deaths compared to 37.3% of all deaths in 2019. Based on this, it would be expected that the individual life insured population may see a smaller impact from COVID-19 deaths than the general population due to the insured population being comprised of people in the higher socioeconomic bands. However, how much smaller the impact will be is still unknown.
Change in Trends for Other Causes of Death
The increase in the U.S. population mortality rate in 2020 is not fully explained by COVID-19 deaths alone. The overall mortality rate (not age-adjusted) for 2020 was 18% higher than 2019. When all deaths due to COVID-19 were excluded (including deaths where COVID-19 was only listed as a contributing cause), the overall mortality rate for 2020 was still 5% higher than 2019. The graph below shows the distribution of deaths by cause of death.
Distribution of Deaths Across Age by Cause of Death, Sex and Age
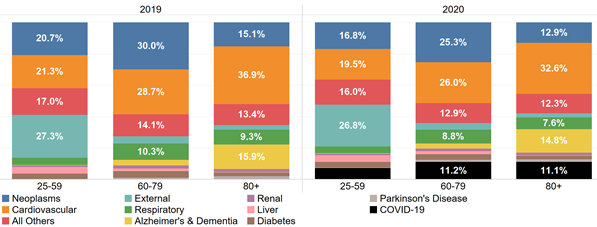
For all ages combined, the top three individual causes of death were cardiovascular disease, neoplasms and COVID-19. Increases in cardiovascular deaths, “all other” deaths and external deaths made up a significant portion of the additional 5% increase in the overall mortality rate that was not directly attributed to COVID-19.
It is worth noting that the individual life insured population has underwriting standards in place that remove some of the risks from cardiovascular disease. In prior years, this resulted in the order of the top two causes of death being reversed for the fully-underwritten insured population, with neoplasms as the top cause of death and cardiovascular deaths the second. Therefore, the overall increases in the mortality rates may be muted for the insured population compared to the U.S. population due to the smaller impact of cardiovascular deaths on the insured population in general.
Several other top 10 causes of death saw a significant percentage increase in the mortality rate for 2020 when compared to 2019. The following graph illustrates the annual percentage change in the mortality rate (excluding COVID-19) by cause of death for the most recent five years of experience.
Change in U.S. Population Mortality Rate (Year Over Year) by Cause of Death –
Excludes All Deaths from COVID-19
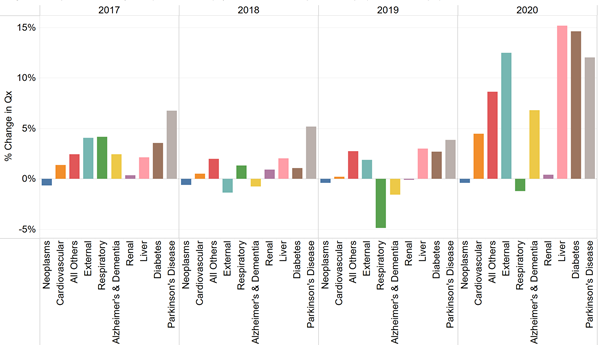
All of the U.S. population’s top 10 causes of death (excluding all deaths from COVID-19) saw increases in the mortality rate for 2020 compared to 2019 except for deaths due to neoplasms and respiratory diseases. This was the largest year-over-year increase for each of these causes of death in the last five years with the exception of renal, which saw a larger increase in 2018. Liver and diabetes saw the largest increases, followed by external deaths and Parkinson’s disease.
The increase in the mortality rate for external deaths is largely driven by the increase in opioid deaths (38.2% increase in 2020), other accidental poisonings (16.3% increase in 2020) and homicides (28.4% increase in 2020). These are all causes of death that are less significant for the insured population. However, the mortality rate for suicides, which is one of the top external causes of death for the younger ages in the insured population, decreased by 3.6% in 2020.
The mortality rate for neoplasms decreased by 0.4% in 2020. However, when death certificates that included COVID-19 as a contributing cause (not the underlying cause) were included, the mortality rate for neoplasms held constant with a 0.0% change over 2019. The mortality rate for respiratory diseases decreased by 1.2% in 2020. This was driven by the non-existent 2020/2021 flu season due to social distancing, masking and increased vaccinations.
Conclusion
There is ongoing analysis being performed by SCOR’s U.S. Experience Analysis team not only to understand the drivers of the trends observed and the impacts of the COVID-19 pandemic but also to compare what is seen in the general population directly to SCOR’s experience with the U.S. insured population. This will allow for a better understanding of the differences between the general population and insured mortality by observation year, age and key causes of death.
If you are interested in learning more about the findings of the U.S. population cause of death analysis, SCOR’s U.S. Experience analysis team would be happy to discuss their findings.
Endnote
1 Age adjusted death rates are weighted averages of the age-specific death rates, where the weights represent a fixed population by age. This allows for year-to-year comparisons using the same age distribution across time.